
What Is Trend Analysis, and How Do I Use It Without Fooling Myself?
Sales wobble, metrics spike, and I panic—then I realize I never checked if a real pattern existed.
Trend analysis is the process of examining data over time to identify consistent patterns (up, down, or flat) so I can forecast, plan, and act with less guesswork.
Before I go deep, I set one rule: I only call something a “trend” when it holds across time windows and makes sense with context. That simple rule keeps me calm and stops me from chasing noise.
What Is Trend Analysis?
Trend analysis is a method I use to spot directional movement in data across time, then explain what might be driving it. I do not treat it as “chart watching.” I treat it as structured thinking: what changed, when it changed, and whether it keeps changing in the same direction.
A trend can be upward, downward, seasonal, or stable. A one-week spike is not a trend by default. A flat line can also be a trend, and it can be valuable because stability is information. I also separate “trend” from “cause.” Trend analysis tells me what is happening over time. It does not automatically prove why it is happening. That is where I need context, segmentation, and sometimes experiments. When I do this well, trend analysis helps me decide whether I should invest, pause, or change direction. When I do it badly, it turns into emotional reacting to graphs. So I always add one line in my notes: “What decision will I make if this trend is real?” That keeps the work practical.
What Data Should I Use for Trend Analysis?
I use data that is time-stamped, consistent, and tied to a real business outcome, like demand, conversion, retention, or cost. If the data is messy, the trend will be messy too, and the conclusion will be weak.
I start with metrics that reflect behavior, not just attention. For example, revenue, conversion rate, churn, retention, and repeat purchase tell me more than raw page views. Then I add supporting metrics that explain the path, like traffic sources, funnel steps, product usage events, or support volume. I also segment early, because averages hide truth. A “flat” average can hide a growing segment and a shrinking segment at the same time. So I compare trends by channel, region, customer type, or product plan. If I am analyzing market trends, I add external signals like competitor pricing changes or category seasonality, but I keep them as context, not proof. When my notes are scattered across dashboards and screenshots, I sometimes paste the raw bullets into Astrodon’s Business Lens AI to structure them into a clean list of “signals vs possible drivers,” then I rewrite the final story in simple words.
How Do I Do Trend Analysis Step by Step?
I do trend analysis by choosing a clear metric, picking the right time window, checking seasonality, segmenting the data, and only then forming a hypothesis. I follow the same order every time so I do not cherry-pick.
Here is the workflow I use:
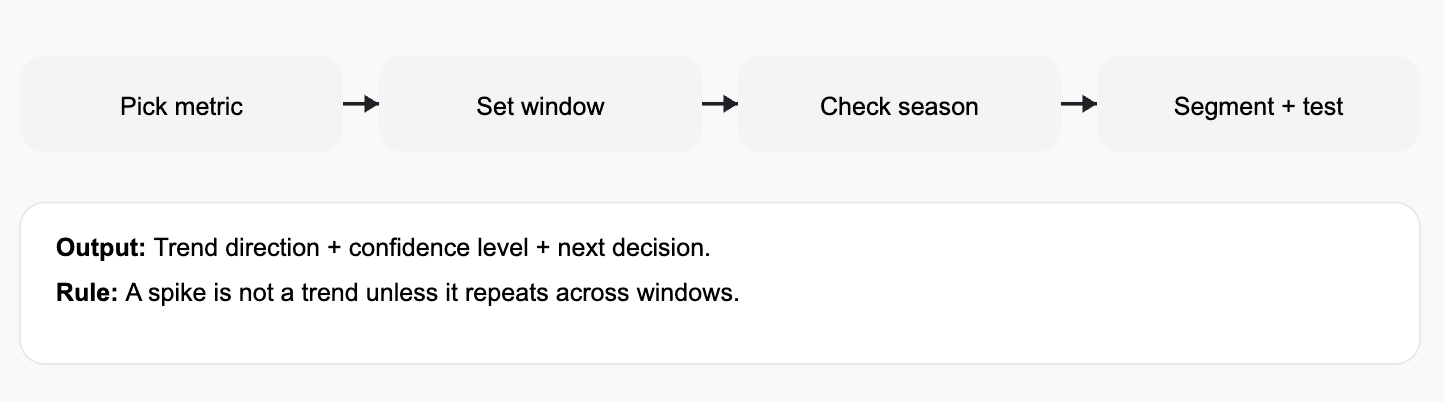
In practice, I run two time windows side by side, like 7 days vs 28 days, or 4 weeks vs 12 weeks. If the story changes completely, I lower my confidence. Then I check for seasonality, because many businesses have weekly cycles, payday cycles, or holiday cycles. After that, I segment. If a trend only exists in one channel, then the “trend” is really a channel issue, not a market issue. Finally, I write a hypothesis in one sentence and attach a next step. ✅ This last step matters because trend analysis without action is just reporting.
What Mistakes Should I Avoid When I Interpret Trends?
I avoid trend mistakes by not overreacting to short windows, not mixing metrics with different definitions, and not confusing correlation with cause. These are the three traps that waste time.
First, I do not trust tiny windows. A few days can be mood data, not market data. Second, I keep metric definitions stable. If “active user” changed last week, then the chart is lying. Third, I do not assume a cause just because two lines move together. If conversion drops when traffic rises, that could be lower quality traffic, a broken page, a new competitor, or even a tracking bug. So I pressure-test with a simple checklist: Is tracking stable? Did anything change in product, price, place, or promotion? Did the audience mix change? Then I use segmentation to narrow it down. I also watch for “silent factors” like platform changes or one big customer affecting averages. To keep myself honest, I label my conclusion with a confidence emoji: 🟢 high, 🟡 medium, 🔴 low. It sounds silly, but it stops me from presenting guesses as facts.
Conclusion
Trend analysis finds real patterns over time so I can act with less noise and more signal.